
| Home Ľ Reviews Ľ Forums Ľ News 2015 Ľ 2013 Ľ 2012 Ľ 2009 Ľ 2008 Ľ 2007 Ľ 2006 Ľ 2005 Ľ 2004 RSS Feeds Ľ FOV Factor Table Ľ Sensor Sizes | Definitions: A-D Ľ E-H Ľ I-L Ľ M-P Ľ Q-U Ľ V-Z | Sitemap Articles Ľ Archived Websites (Pre-DigitalDingus): D100 Lounge Ľ E-10 Club | Contact |
 |
| The Imaging Power Behind The Olympus E-300 |
| October 18, 2004 |
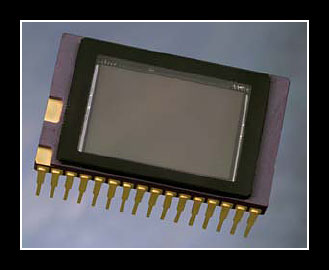
Kodak has released more information on their KAF-8300CE sensor. The KAF-8300CE is an 8.3MPa (Active Megapixel) imager. The term Active Pixel is the latest terminology which more accurately describes how many pixels are actually being viewed within an image. Let's take a look at the specifications, along with a comparison to the E-1's imager... |
| Kodak 4/3 KAF-8300CE | |||
| Pixel Count (H) | Pixel Count (V) | Total (H x V) | |
| Total Pixels | 3448 | 2574 | 8,875,152 |
| Effective Pixels | 3358 | 2536 | 8,515,888 |
| Active Pixels | 3326 | 2504 | 8,328,304 |
| KAF-8300CE vs. KAF-5101CE | |||
| Olympus E-300 | Olympus E-1 | ||
| Pixel Size (H x V) | 5.4Ám x 5.4Ám | 6.8Ám x 6.8Ám | |
| Chip Size (H x V) | 19.7mm x 15.04mm | 19.7mm x 15.04mm | |
| Imager Size (Diagonal) | 22.5mm | 22.3mm | |
| Saturation Signal | 25.5K e- | 40K e- | |
| Quantum Efficiency (RGB) | 0.32, 0.40, 0.32 | 0.31, 0.34, 0.31 | |
| Total Sensor Noise | 16 e- | 17 e- | |
| Linear Dynamic Range | 64.4 dB (64.05?) | 67 dB | |
| Maximum Data Rate | 28 MHz | 28 MHz | |
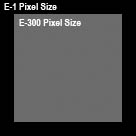
| 5.4Ám2 vs. 6.8Ám2 |
The E-300's total pixel area is 29.16Ám. The E-1's TPA is 46.24Ám. This translates to about 36.9% less area than the E-1. Below is an illustration of the E-300's pixel overlayed on an E-1 pixel, to give you an idea of the different sizes. The illustration is to scale, but has been enlarged so you can actually see it: |
 |
| Blooming Protection |
Kodak says each pixel of the KAF-8300CE has blooming protection by means of a lateral overflow drain. Smaller pixels tend to have a much harder time retaining light and this light often overflows into adjacent pixels, resulting in a "bloomed" image; the overflow of these pixels tends to discard the image information in the surrounding pixels in the process. You can see an example of this when viewing images of trees and a bright clear sky in the background. |
| Saturation Signal Difference |
About the only notable difference, is the E-300's Saturation Signal, however this is not a bad thing. As pixel size decreases, so does your saturation signal. If we think in terms of a pixel being a bucket or well, a rating of 25.5K e-, means the pixel can carry up to 25,500 electrons in it's "well", before those electrons overflow into adjacent pixels (the electrons in the well are converted in photoelectrons when hit with light--photons). And just as we look at the E-1 40K e- rating, this means each pixel hold 40,000 electrons (which can be converted into photoelectrons). If we look at the pixel sizes, you will notice a change of about 20.6% (5.4 / 6.8). However, that number can be misleading, because we are talking about pixel area, which if we use the 20.6% number, it's implication is out of context. For example, you're probably thinking that the K e- number of the E-300 sensor should be 31.76 K e- (meaning a well depth of 31,760 photoelectrons), because we simply take 40,000 and multiply it by .206 and then subtract it from the 40,000, resulting in 31,760. But this is not the case, and I will explain why. When we compare pixels and their saturation signal, we should take into account the area of those pixels. In other words, we must use the following formulae: p12 / p22 = pa
p12 = Area of Pixel #1 (should be the smaller pixel number). Let's go ahead and try it with the numbers we already have: 5.4Ám2 (29.16) / 6.8Ám2 (46.24) = .6306 (i.e., 63%) Now, let's introduce some other numbers: 25.5 / 40 = 0.6375 Now, here is where the real differences are to be found. Take .6306 (the percentage of the area of the bigger pixel) and divide it by .6375 (the percentage of the number of photoelectrons in the bigger pixel's well), and we get ~0.98917. Round it off, and we get .99, or 99%. What this tells us, is the pixels have depreciated in their saturation levels by virtually an unnoticeable difference. In other words, the E-300's sensor's saturation has decreased by 1%, which is just fine. |
| Linear Dynamic Range |
The E-300 sensor's Linear Dynamic Range (LDR or DR) differs just slightly from the E-1. Will this make a difference in image quality? Strictly taking the numbers and using a special formula to determine the dynamic range, you might be surprised. Dynamic Range is expressed in Decibels, i.e., dB. We get the dB number by the following forumula:
1) Nsat is maximum amount of electrons that the pixel can hold (i.e., it's "well limit"). 2) Nnoise is the maximum number of electrons which exhibit noise in each pixel. What we get is this: Step 1: Dynamic Range = 20 x Log(25,500/16) Step 2: Dynamic Range = 20 x Log(1593.75) Step 3: Dynamic Range = 20 x 3.2024 Step 4: Dynamic Range = 64.048 Step 5: Dynamic Range = 64.05dB The E-1's Dynamic Range can be figured by just plugging in it's respective numbers. I think Kodak misplaced one of their numbers as we don't get 64.4, we get 64.05. However, if we do the E-1 figures, we get the same dB as they do (actually, 67.43dB). Once again, the E-300 sensor is no slouch on the numbers and is just as good--at least on paper--as the E-1's sensor.
|
| Quantum Efficiency |
QE, or Quantum Efficiency, is a term which describes and measures a percentage of how many incoming photons are being captured in the pixel's well depth, per color channel--Red, Green, and Blue. So, when we look at the E-300's QE RGB numbers, what we know is this: 1) In the Red Channel domain, 32 out of 100 incoming photons hitting the CCD, are detected by the imager 2) In the Green Channel domain, 40 out of 100 incoming photons hitting the CCD, are detected by the imager 3) In the Blue Channel domain, 32 out of 100 incoming photons hitting the CCD, are detected by the imager This is actually quite typical of a front-illuminated CCD. And to put things into perspective, film has around 3-10% QE in all channels (the percentages vary), and the human eye has about the same. This certainly puts a perspective on the film vs. digital debate. If you notice above, the Green channel of the E-300 is more sensitive (i.e., more photons are detected) than the same channel of the E-1, by about 15%.
|
| Conclusion |
What we see on paper, and what finally becomes an image, are two different things. My statements above are only in reference to the numbers published by Kodak. Real testing, in determining if the E-300 can produce as good an image as the E-1, will have to wait until we see image samples. However, all things being equal, it does appear as if the E-300 will produce higher resolution photos at the same quality as the E-1. |
| Recommended Websites On The Olympus E-System |
I only have a select few of people I recommend, and Andrzej ("Un-jay") Wrotniak is one of the leaders of Olympus equipment reviews. He takes a lot of time going over Olympus cameras, and is very thorough. The E-300 is no exception. Please visit the Olympus E-300, a Technical Review page for much more info on the E-300. Jˇn Ragnarsson's FourThirds Website and Blog is a great place to visit for the latest scoop on Olympus E-System cameras and lenses. Recently noticed was the E-500, the most inexpensive Olympus DSLR yet. He also has several images of Olympus E-System lenses. Other websites I recommend are:
FourThirdsFaq
|
| Home Ľ Reviews Ľ Forums Ľ News 2015 Ľ 2013 Ľ 2012 Ľ 2009 Ľ 2008 Ľ 2007 Ľ 2006 Ľ 2005 Ľ 2004 RSS Feeds Ľ FOV Factor Table Ľ Sensor Sizes | Definitions: A-D Ľ E-H Ľ I-L Ľ M-P Ľ Q-U Ľ V-Z | Sitemap Articles Ľ Archived Websites (Pre-DigitalDingus): D100 Lounge Ľ E-10 Club | Contact |